How to Compare Two PC Builds Side by Side (Tool Walkthrough)
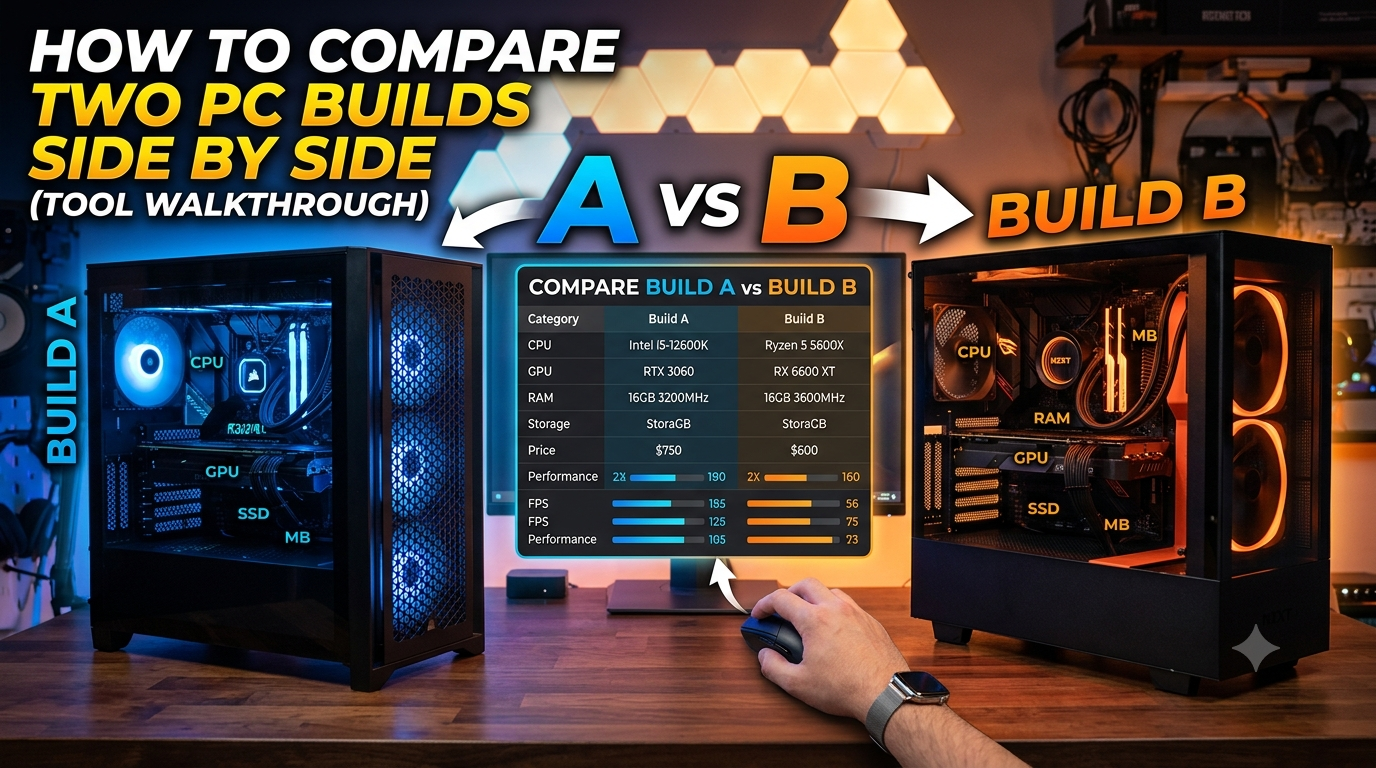
Comparing two PC builds side by side before buying is the most effective way to determine whether upgrading to a higher-tier component actually delivers proportional performance gains for your specific use case and budget. The Compare Systems tool lets you enter two complete builds different CPUs, GPUs, or both and see their bottleneck percentages, relative performance estimates, and which component limits each configuration at your chosen resolution.
Why Side-by-Side Build Comparison Matters
Making hardware decisions in isolation"this CPU gets good reviews" or "this GPU has higher specs misses the fundamental question: how do these components interact with each other, and does a more expensive option actually deliver better real-world results given your other components?
Side-by-side comparison answers three specific questions that individual component reviews cannot:
- Does the more expensive build actually reduce the CPU bottleneck? A $200 GPU upgrade might look impressive on paper but deliver only 3% less bottleneck percentage than the cheaper option.
- Is the performance delta worth the price delta? Comparing builds shows you the output difference; you supply the cost difference; together they reveal whether the upgrade is efficient.
- Which build matches better for your target resolution? A configuration that looks superior at 1080p may be virtually identical at 4K, making the premium pointless for 4K gamers.
Step-by-Step: Using the Compare Systems Tool
Step 1: Define Your Two Scenarios
Before opening the Compare Systems tool, decide what you're actually comparing:
- Current vs Upgraded: Your existing build vs the build with one upgraded component
- Option A vs Option B: Two different GPU or CPU candidates at different price points
- Now vs Future: Your day-one build vs your anticipated build after a planned upgrade 12 months from now
Having a clear comparison objective makes the results immediately actionable rather than just informational.
- Why Side-by-Side Build Comparison Matters
- Step-by-Step: Using the Compare Systems Tool
- Step 1: Define Your Two Scenarios
- Step 2: Enter Build A (Your Current or Baseline Configuration)
- Step 3: Enter Build B (Your Upgrade or Alternative)
- Step 4: Set Your Target Resolution
- Step 5: Read the Comparison Output
- Practical Use Cases for the Compare Systems Tool
- Use Case 1: GPU Upgrade Decision
- Use Case 2: CPU Upgrade Value Assessment
- Use Case 3: Platform Change Evaluation
- Use Case 4: Future Upgrade Planning
- What the Compare Tool Doesn't Do
- Tips for Getting the Most Out of Build Comparisons
- Key Takeaways
Step 2: Enter Build A (Your Current or Baseline Configuration)
In the first build column, enter:
- Your CPU model (exact variant e.g., Ryzen 7 7800X3D, not just "Ryzen 7")
- Your GPU model (exact variant RTX 4070 Super is different from RTX 4070)
- Your RAM capacity
- Your storage type
- Your target resolution
This becomes your baseline the reference point against which the second build is measured.
Step 3: Enter Build B (Your Upgrade or Alternative)
In the second column, change only the component(s) you're actually comparing. If you're evaluating a GPU upgrade, keep the CPU identical and change only the GPU. If you're comparing two full build options, change whatever differs.
The Compare Systems tool is most useful when the differences between Build A and Build B are clearly isolated — changing both CPU and GPU simultaneously makes it harder to understand which change drove which improvement.
Step 4: Set Your Target Resolution
Select your actual gaming resolution 1080p, 1440p, or 4K. This is critical because:
- A build comparison at 1080p shows larger CPU bottleneck differences between configurations
- The same comparison at 4K may show near-identical results because the GPU dominates at that resolution
- If you play at 1440p, checking 1080p results is misleading
Step 5: Read the Comparison Output
The tool returns results for both builds simultaneously. Key figures to focus on:
Bottleneck Percentage (Build A vs Build B): How much does each build's CPU bottleneck the GPU? A 15% vs 8% result means Build B has roughly half the CPU bottleneck a meaningful improvement. A 14% vs 12% result means the upgrade barely moves the needle.
Which Component Is Limiting Each Build: The tool identifies whether the CPU or GPU is the limiting factor in each configuration. This tells you which upgrade direction is more impactful.
Performance Relative Score: A comparative performance index showing which build is estimated to deliver more total performance at your resolution.
Practical Use Cases for the Compare Systems Tool
Use Case 1: GPU Upgrade Decision
You own a Core i5-13600K + RTX 4070 and want to know if upgrading to an RTX 4070 Ti Super is worth it.
Enter:
- Build A: i5-13600K + RTX 4070 at 1440p
- Build B: i5-13600K + RTX 4070 Ti Super at 1440p
The Compare Systems tool shows the bottleneck percentage for both. If Build B shows a 15% CPU bottleneck vs Build A's 8% CPU bottleneck, the upgraded GPU is being partially held back the CPU already limits it. The raw FPS gain from the GPU upgrade will be less than the hardware tier difference suggests.
Use Case 2: CPU Upgrade Value Assessment
You're deciding between staying with a Ryzen 5 7600X or spending more on a Ryzen 7 7800X3D with your existing RTX 4070 Super.
Enter:
- Build A: Ryzen 5 7600X + RTX 4070 Super at 1440p
- Build B: Ryzen 7 7800X3D + RTX 4070 Super at 1440p
If the bottleneck difference at 1440p is only 3 percentage points, the 7800X3D premium may not be worth it for 1440p gaming — though the comparison at 1080p might show a larger gap that matters for competitive play.
Use Case 3: Platform Change Evaluation
You want to know if migrating from AM4 (Ryzen 5 5600X) to AM5 (Ryzen 7 7800X3D) while keeping your RTX 4070 is worth the platform cost.
Enter:
- Build A: Ryzen 5 5600X + RTX 4070 at 1440p
- Build B: Ryzen 7 7800X3D + RTX 4070 at 1440p
The tool shows the bottleneck improvement from the platform change helping you decide whether that improvement justifies the cost of new CPU + motherboard + DDR5 RAM.
Use Case 4: Future Upgrade Planning
You're buying today but want to plan your next upgrade. Enter your current build as Build A and your anticipated 12-month future build as Build B to see whether the planned upgrade closes the bottleneck gap meaningfully.
What the Compare Tool Doesn't Do
The Compare Systems tool shows performance relationships based on benchmark data it doesn't:
- Calculate prices or price-to-performance ratios (you supply the cost information)
- Account for specific game-to-game variation (pair with the FPS calculator for game-genre-specific estimates)
- Measure real-time system performance (use your operating system's performance monitor for that)
Tips for Getting the Most Out of Build Comparisons
- Always compare at your actual gaming resolution not the default or your monitor's maximum
- Isolate one variable at a time the clearest comparisons change only one component between builds
- Cross-check with the bottleneck calculator use the bottleneck calculator individually for each build if you want detailed component-specific analysis
- Run the comparison before every major purchase even if you're confident in your choice, the comparison often reveals that a slightly different configuration delivers better value
Key Takeaways
- Side-by-side build comparison reveals whether a more expensive component actually delivers proportional performance gains for your specific use case individual component benchmarks cannot show this.
- The Compare Systems tool returns bottleneck percentages and performance estimates for both builds simultaneously at your target resolution.
- Always set the correct resolution and isolate one variable at a time for the clearest, most actionable comparison results.
- The most valuable use cases are: GPU upgrade decisions, CPU upgrade value assessment, platform migration evaluation, and future upgrade planning.
- Pair the Compare Systems tool with the FPS calculator for game-genre-specific performance estimates and the bottleneck calculator for detailed single-build bottleneck analysis.