How Bottleneck Calculators Actually Work (Behind the Algorithm)
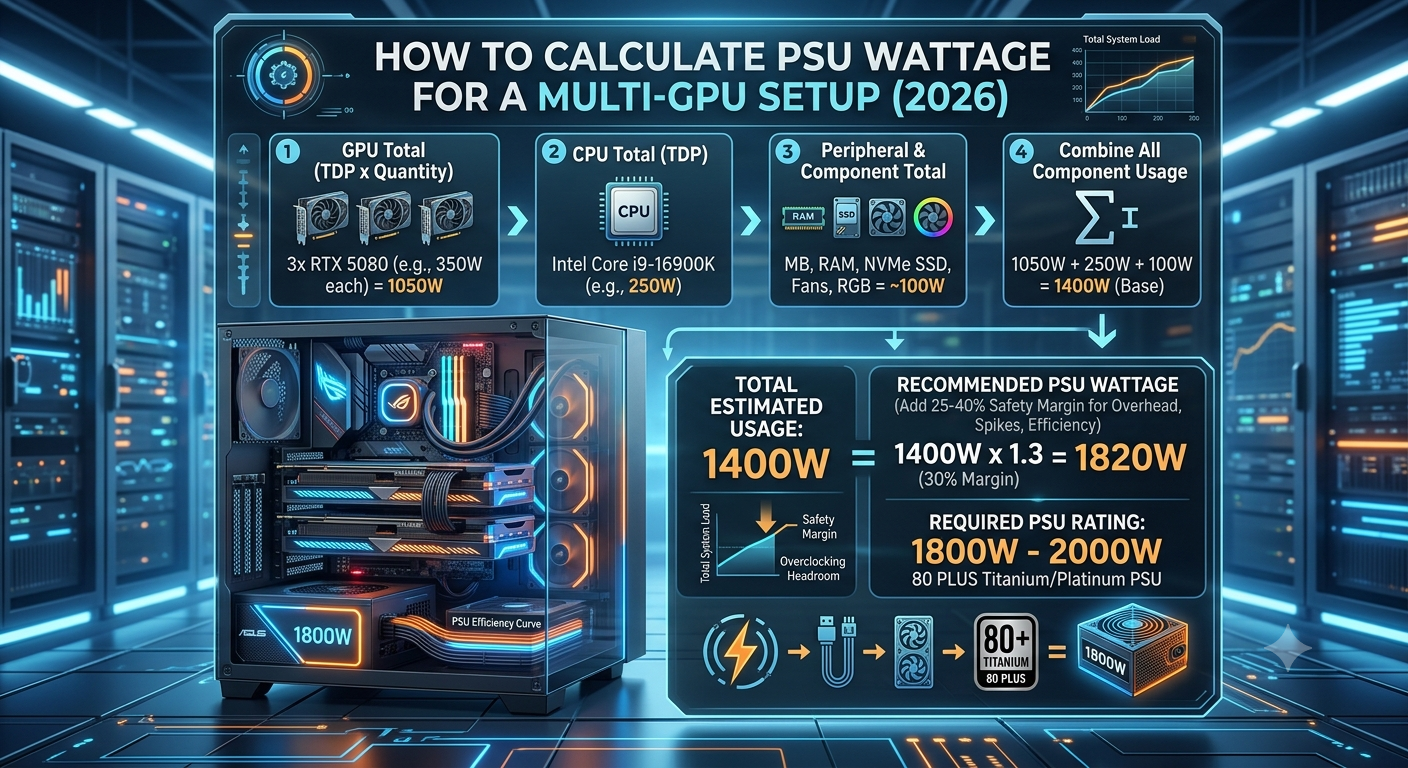
A bottleneck calculator works by comparing normalized benchmark performance scores for your selected CPU and GPU, then calculating the percentage gap between them, weighted by your chosen resolution and use case. The component with the lower relative score for that configuration is identified as the limiting factor, and the gap between scores becomes the bottleneck percentage. No real-time monitoring is involved it's a database comparison of aggregated benchmark data.
Step 1: Benchmark Score Collection
Every CPU and GPU in the calculator's database has a performance score derived from aggregated benchmark data. These scores are collected from a combination of:
- Synthetic benchmarks (standardized tests that isolate specific aspects of performance, like Cinebench for CPUs or 3DMark for GPUs)
- Game benchmarks (real-world frame rate results across a range of titles at multiple settings)
- Multi-source aggregation (combining results across hardware review databases to reduce the influence of single-run outliers)
These scores are then normalized converted to a common scale so a CPU score and a GPU score can be directly compared even though they measure different types of performance.
Step 2: Resolution and Use Case Weighting
Raw benchmark scores are not equal across all configurations. A CPU's relative importance changes significantly depending on resolution and workload:
- At 1080p, the CPU's performance score is weighted more heavily, because the GPU renders frames faster at low resolutions, putting more relative pressure on the CPU to keep pace
- At 4K, the GPU's performance score is weighted more heavily, because rendering four times the pixels means the GPU becomes the dominant workload
- For professional use cases, CPU scores are weighted differently again multi-threaded performance and memory bandwidth matter more, and GPU scores may factor in VRAM capacity
This weighting is what causes the same CPU/GPU combination to return different bottleneck percentages at different resolutions on the bottleneck calculator.
Step 3: Calculating the Gap
Once both components have a weighted score for the selected configuration, the calculator computes the percentage difference between them:
- If the CPU score is lower than the GPU score after weighting, the CPU is identified as the limiting component, and the gap is the bottleneck percentage
- If the GPU score is lower, the GPU is the limiting component
- The larger the gap, the higher the bottleneck percentage
A result of 8% means the weaker component's score is roughly 8% below the stronger one's after all weighting is applied — a small imbalance. A result of 35% means the gap is much larger, indicating significant underutilization of the stronger component.
Step 4: Additional Inputs That Modify the Result
RAM capacity, RAM speed, and storage type introduce secondary adjustments to the final result:
- Insufficient RAM (e.g., 8GB) adds a penalty to the overall result, reflecting that memory can independently bottleneck both the CPU and GPU
- Single-channel RAM reduces the effective memory bandwidth, which lowers the CPU's practical performance in memory-sensitive scenarios
- HDD storage adds a secondary bottleneck flag for workloads that involve large file streaming
These factors don't override the CPU/GPU relationship — they layer on top of it to give a more complete, system-level picture.
What the Algorithm Cannot Account For
A benchmark-based calculator has inherent limits that are worth understanding:
- Individual system variation RAM speed, case thermals, driver version, background software, and BIOS settings all affect real-world results that a database comparison cannot predict for a specific machine
- Game-specific weighting the aggregated score reflects performance across many titles; any single game may behave very differently from the average
- Clock-speed scaling an overclocked CPU or GPU may outperform its stock benchmark score, making the calculator's result slightly conservative for tuned systems
- Very new hardware components released very recently may have limited benchmark data, which can affect the accuracy of their database scores until more data is collected
This is why a bottleneck calculator is best treated as a reliable directional guide rather than a precise lab measurement for a specific system and game.
Why Different Calculators Can Return Different Percentages
If you've noticed that two different bottleneck calculators return different percentages for the same CPU/GPU pair, this is expected. Each tool uses:
- Different benchmark data sources and aggregation methods
- Different normalization scales
- Different resolution and use case weighting algorithms
- Different secondary adjustment factors for RAM and storage
None of this makes one "right" and the other "wrong" they're applying slightly different methodologies to the same underlying goal. The directional conclusion (which component is limiting, and roughly by how much) should be consistent across reputable calculators even if the exact percentage differs.
Key Takeaways
- Bottleneck calculators compare normalized, resolution-weighted benchmark scores for your CPU and GPU no live system testing involved.
- Resolution weighting is why the same hardware returns different percentages at 1080p vs 4K, and this accurately reflects how rendering workload actually distributes.
- RAM capacity, RAM speed, and storage type add secondary adjustments on top of the CPU/GPU comparison.
- Individual system factors (thermals, driver version, specific games) can cause real-world results to differ from the calculated estimate treat it as a reliable directional guide.
- Different calculators return different specific percentages because they use different methodologies, but should agree on which component is the limiting factor.
- Use the bottleneck calculator as a comparative decision-making tool, especially before hardware purchases, rather than as an exact per-system measurement.